All posts tagged infographic

Research Online revealed: an in-depth look at repository usage

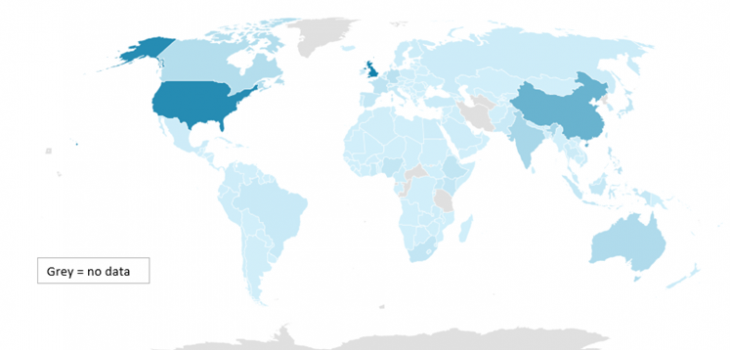
The LSHTM research repository, ‘Research Online’, currently contains 61,867 items, which were downloaded over 55,000 times in 2022-2023. But have you ever wondered exactly who is actually using it?

Well, look no further! We’ve broken down the numbers for an in-depth look at exactly what…

Read more

Open Access Week 2016: How “open” are we? Faculty of Infectious and Tropical Diseases

Now in its ninth year, Open Access Week celebrates progress and promotes awareness to help make Open Access the norm in scholarship and research.

As part of the week’s activities we are sharing some info-graphics we’ve produced in the Library covering Open Access and publications.

The infographic…

Read more

Open Access Week 2016: How “open” are we? Faculty of Epidemiology and Population Health

Now in its ninth year, Open Access Week celebrates progress and promotes awareness to help make Open Access the norm in scholarship and research.

As part of the week’s activities we are sharing some info-graphics we’ve produced in the Library covering Open Access and publications.

The infographic…

Read more

Open Access Week 2016: How “open” are we? Faculty of Public Health and Policy

Now in its ninth year, Open Access Week celebrates progress and promotes awareness to help make Open Access the norm in scholarship and research.

As part of the week’s activities we are sharing some info-graphics we’ve produced in the Library covering Open Access and publications.

The infographic…

Read more