Today’s books from the LSHTM Historical Collection consist of some early attempts at gathering statistics on disease and society. Lots of the Collection significantly predates the foundation of LSHTM, which includes these volumes. Instead, the Library acquired them during the School’s early history, often through donations and bequests. This blogpost will take you through a few of the different ways books from the Collection presented data and findings, including tables, charts and maps.
Short’s New Observations, Natural, Moral, Civil, Political and Medical on City, Town, and Country Bills of Mortality
Our edition of this book was published in 1750 in London. It contains tables from bills of mortality and parish registers. It also includes “observations” about how and why people might fall sick and die. Short also delves into a sort of epidemiology: he analyses the spread of epidemic disease in “sickly” years, seasonal diseases, and more.
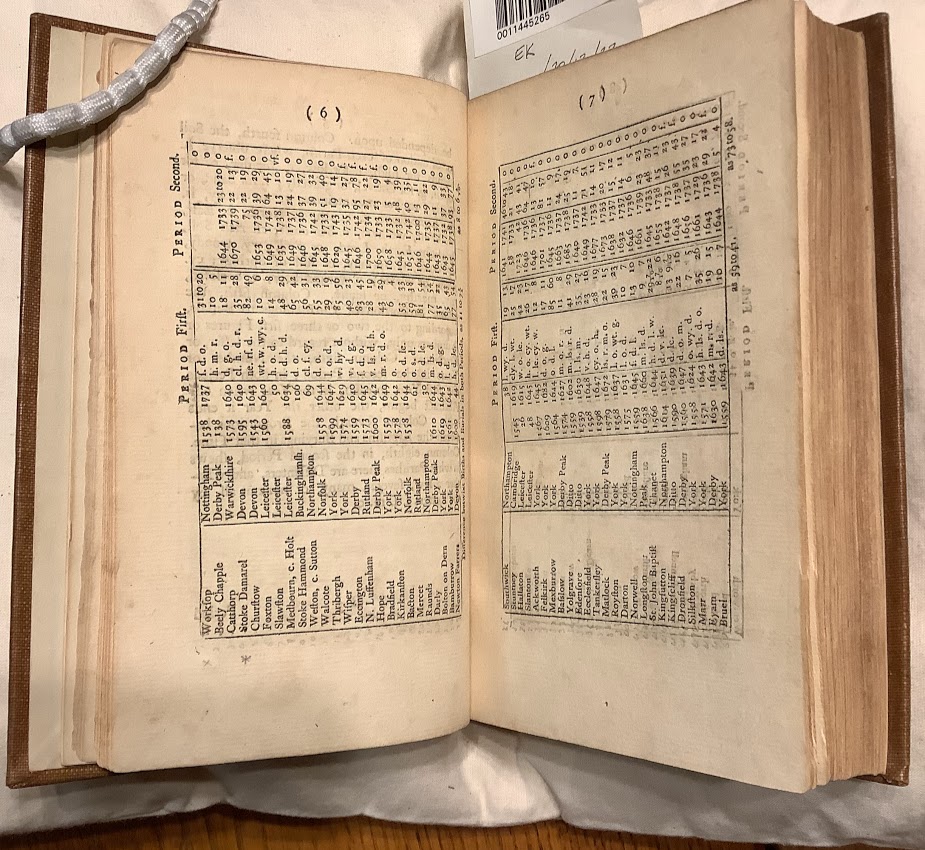
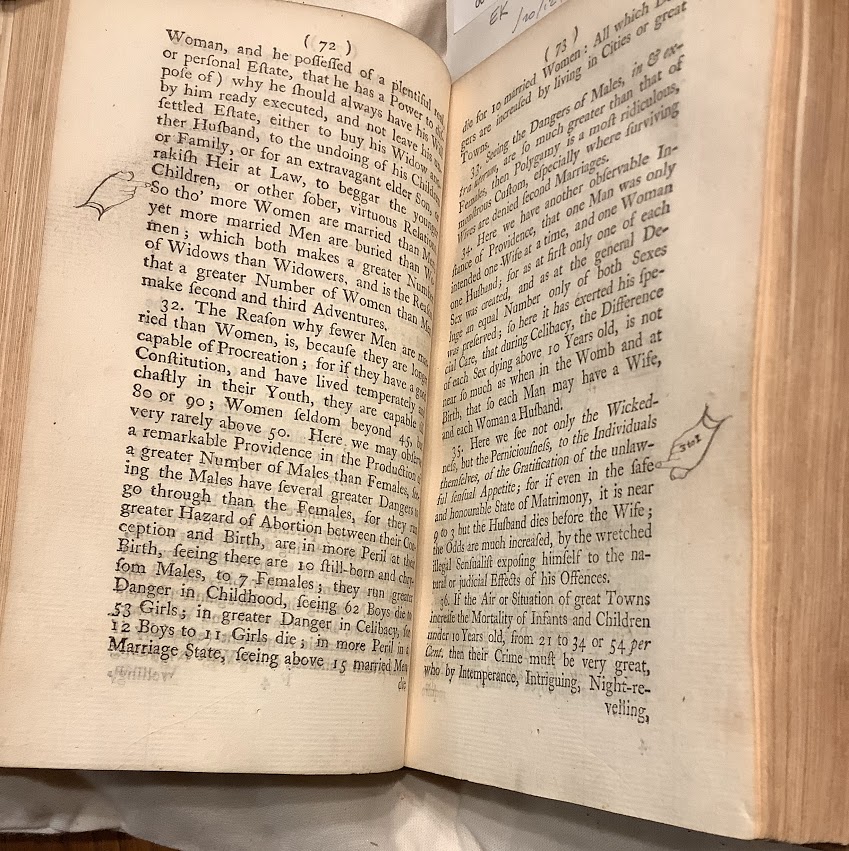
Yet Short frequently intersperses his number-crunching on births, marriages, and deaths with commentary on the nation’s morals and religion. For instance, activities Short especially opposed for health reasons included “Night Revelling,” “Passions,” and “theatrical Adventures and Intrigues.” (p.84). That suggests that Short saw strong links between contemporary behaviours and health. A past owner found his observations about marriage rates and morality (pp.72-3) especially interesting, adding pointing fingers to certain phrases – see below!
The Geographical Distribution of Disease in Great Britain (Part 1. Cumberland, Westmorland, and the Lake District).
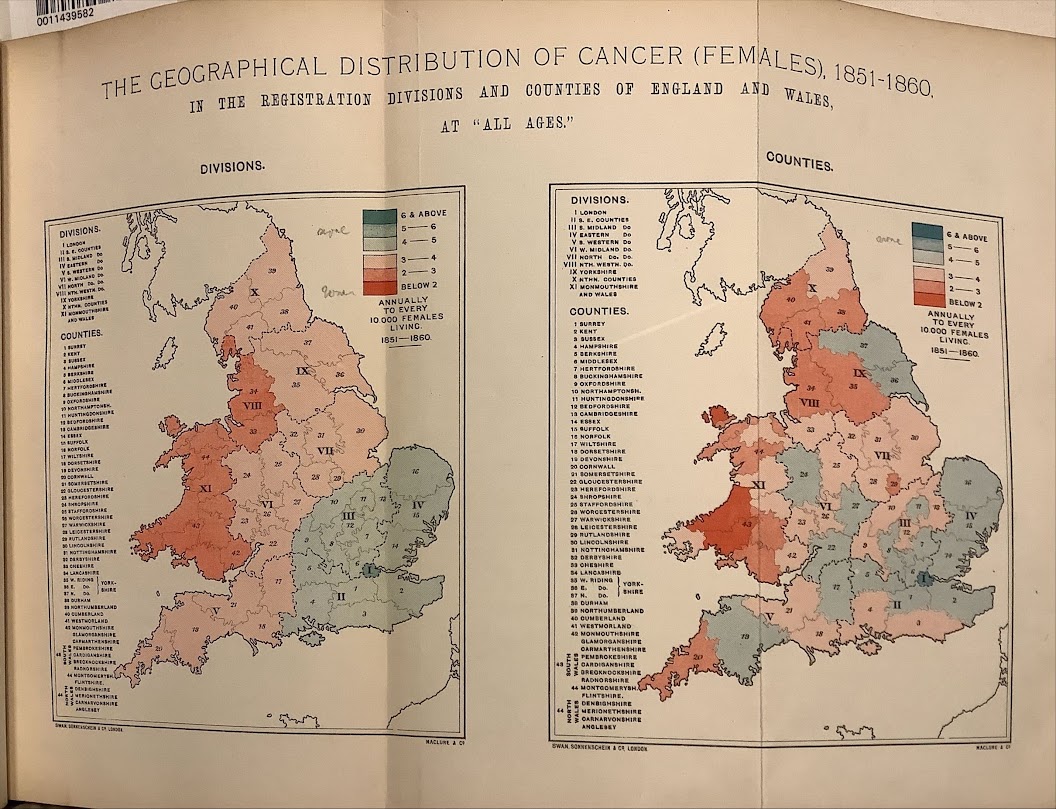
Sometimes statistics could be used to advance theories now known to be wrong. This is the case for this volume, written by Aldred Haviland. It contains some beautifully colourful maps in its attempts to advance the theory that geological phenomena caused cancers. For more on Haviland’s maps, see Frank A Barrett’s 1998 article. Additionally, he engages with theories circulated by contemporary anthropologists and ethnologists, primarily those of John Beddoe. Beddoe’s work, focusing on creating a typology of races in Britain and in particular categorising their hair or eye colour and skull measurements, means this geological-medical treatise can also be linked with the scientific racism of the time.
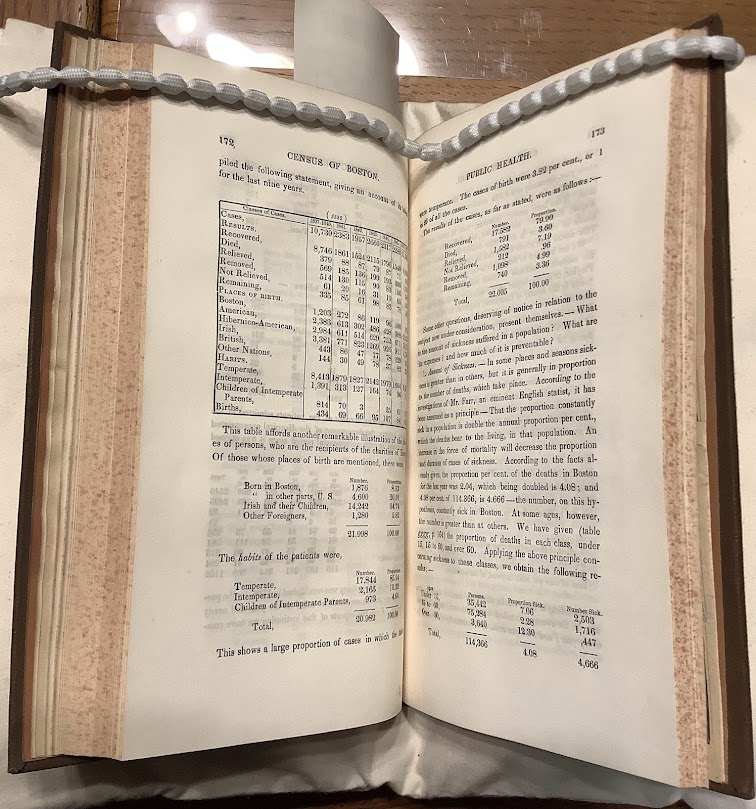
Report to the Committee of the City Council appointed to obtain the census of Boston for the year 1845
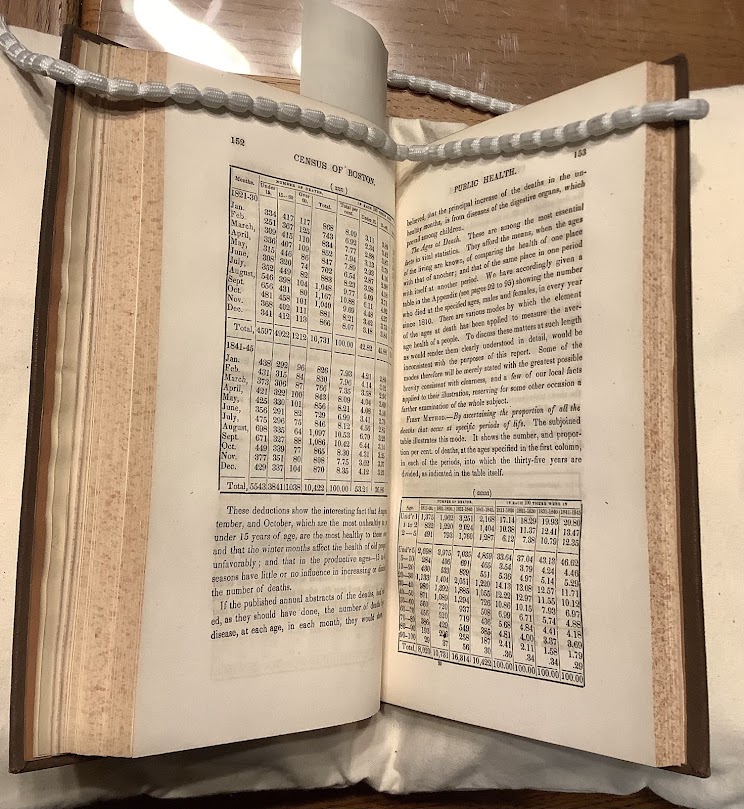
This volume offers a variety of statistics, from population numbers to education, wealth, crime, religious affiliations, and places of birth. Indeed, the public health section explores birth and death rates, along with statistics for various health facilities in the city. This included the Boston Medical Dispensary, an institution established in the late eighteenth century that was one of the first hospitals in the United States of America.
A Contribution to the Demography of South Australia
This volume, by T. Borthwick, was presented to the Library in the 1930s despite its 1891 publication date. It begins with south Australia’s geology and geography, proceeding to describe its population, including age distributions and country of birth, and birth-, marriage- and death-rates. It ends with a series of sections on different diseases, from malaria to diphtheria, and includes several charts at the very end.
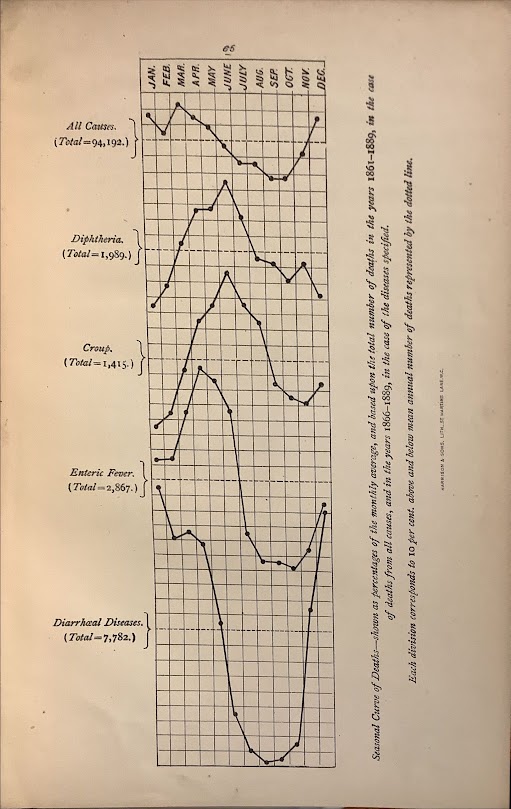
The graph above, used to illustrate mortality and mortality from diseases during different months of the year, demonstrates how all-cause mortality but especially that from diarrheal diseases drops precipitously during the Australian winter months. It’s certainly a lot easier to read and to draw conclusions from than Short’s lengthy tables, with which we began.
Library users are welcome to consult any of these books on Library premises. To reserve a book for consultation, just go to their catalogue entry on Discover while you are logged into your LSHTM account and follow the instructions underneath the heading “Get It.” You’ll receive an email when it’s available. However, please note that these books will need to be read within the Library and cannot be borrowed like most other resources.