


The LSHTM research repository, ‘Research Online‘, currently contains 61,867 items, which were downloaded over 55,000 times in 2022-2023. But have you ever wondered exactly who is actually using it?
Well, look no further! We’ve broken down the numbers for an in-depth look at exactly what’s happening on the platform.
A Global Database
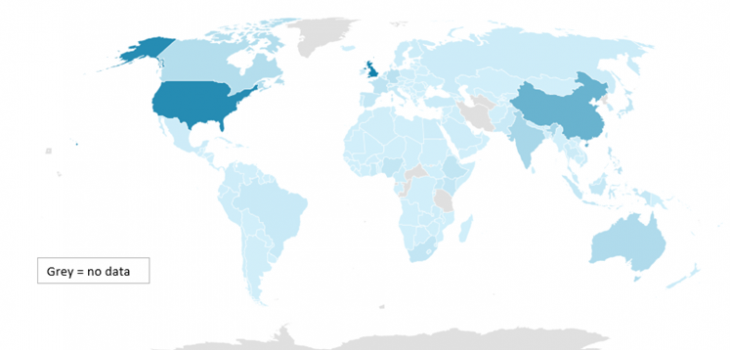
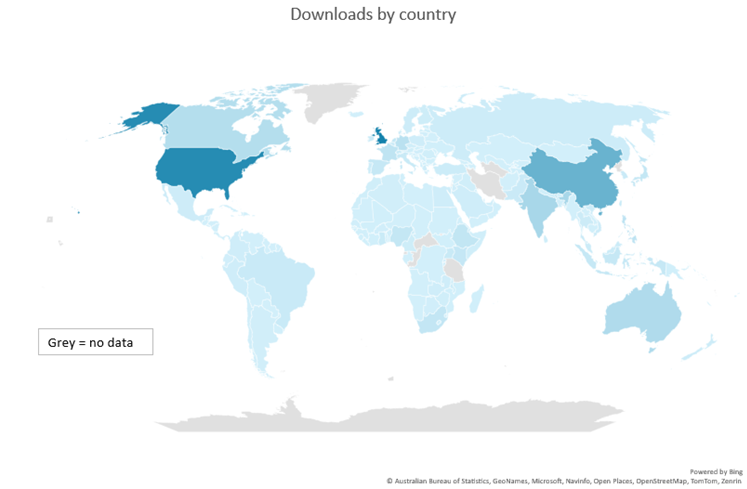
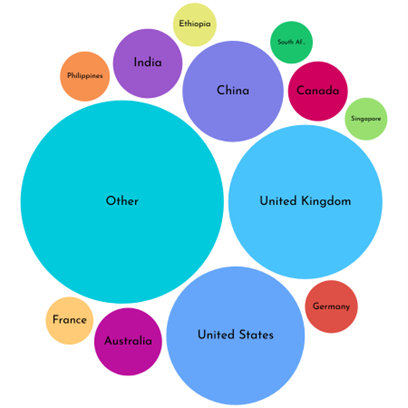
Not only do our researchers come from all over the world, but their research is also being used all over the world. It’s not just those based in London who are using the platform. Data from March 2024 shows that in that month alone, the repository was accessed from almost every country in the world! While the UK, US, and China have the highest number of downloads of any individual country, in fact, the largest number of downloads come from countries outside the top 20, showing that our research really is used globally!
It’s all open
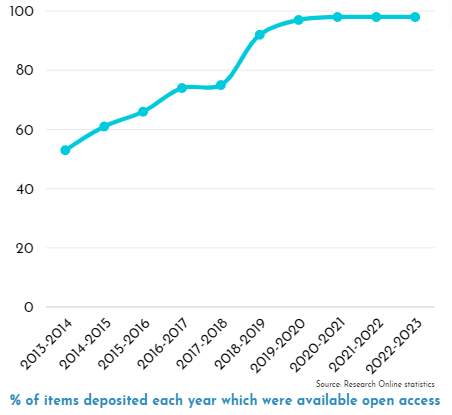
The huge range of people accessing our repository is perhaps not surprising, especially since 62% of its material is available open access from anywhere in the world. Even better, this figure is increasing – while in 2013, only 53% of the material deposited in Research Online was available open access, since 2020, that number has remained consistent at 90%.
Did you know…..?
Over 3000 new items have been added to the repository every year since 2014
Faculty awards
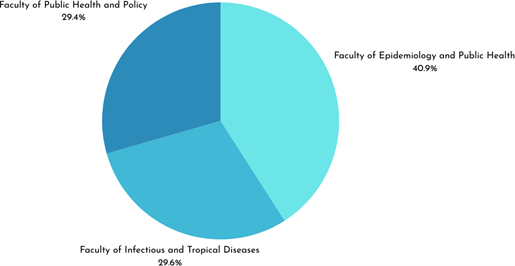
The articles in the repository are split roughly evenly between the School’s three faculties, with just a slightly higher percentage belonging to the Faculty of Epidemiology and Public Health.
However, there are plenty of other ways of measuring the impact of the repository, so we’ve crunched the numbers to reveal exactly where each faculty is doing well.
And the award for…..
Most articles in top ten most downloaded:
goes to…. Faculty of Public Health and Policy (6/10 of the top ten most popular articles are from this faculty)
Highest repository usage:
goes to…… Faculty of Epidemiology and Public Health (nearly twice as many downloads as the other two faculties)
Highest % of articles deposited available open access:
goes to…… Faculty of Infectious and Tropical Diseases (66% of articles are available open access, with 67% having full-text availability)
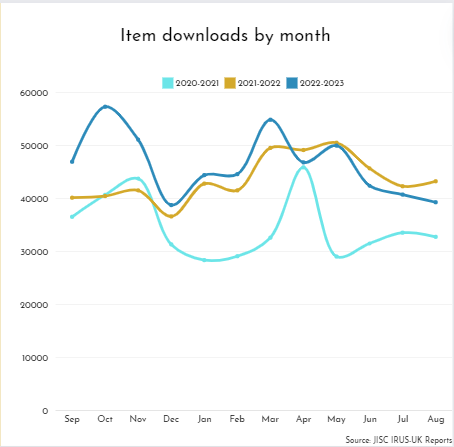
When is the database being used?
Although use of the database tends to fluctuate month by month, it is increasing overall.
What else would you like to know about our repository usage? Let us know in the comments!
