EC50 analysis
Adapted from Raz et al (1997) Acta Trop 68:139; see also, Baker et al (2011) Mol Biochem Parasitol 176:55
What you should end up with…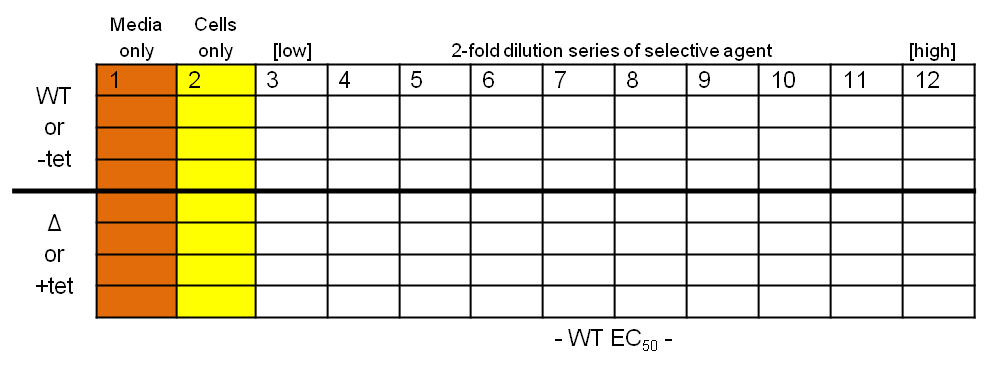 Protocol
- Place 200 µl media into each well in column 1, and 100 µl into all the wells in columns 2-11
- Dilute the selective agent to twice the required high concentration and place 200 µl into each of the wells in column 12
- Take 100 µl from each well in column 12, transfer to column 11 and pipette up and down three times to mix; repeat, generating a two-fold descending dilution series from column 12 to 3, inclusive
- Dilute your wild-type and test T. brucei cell lines to 4×10³ cells per ml
- Place 100 µl cells into each well in columns 2-12 (final concentration of 2×10³ cells per ml)
- Place at 37°C in a 5% CO2 incubator for ~66 hours
After 66 hours add 20 µl 0.125 mg/ml resazurin (Sigma) to each well and incubate for a further 6 hours; the resultant colour change in the presence of living cells (from blue to pink) can be quantified on a plate reader: excitation, 530 nm; emission, 585 nm; filter cut-off, 570 nm
NB: after the final 6 hour incubation, plates can be placed at -20C and analysed the next day, if necessary
Analysis
Process your data in Excel (see analysis template); the output from the reader needs to be converted into ‘% inhibition’ and reorganised for GraphPad Prism.
Using the ‘Analysis’ tab in Graphpad Prism…
- Transform concentrations to Log10
- Normalise so that the smallest ‘% inhibition’ is set at 0% and the largest is set to 100%
- Non-linear regression – constraints, bottom=0 and top=100; comparison, Log10(EC50), using an F-test at 0.05; equation, ‘Sigmoidal dose response (variable slope)’
- This gives a final chart that you can edit and a table of results, including EC50 and Hill slope